GROUNDWATER AVAILABILITY MODELS (GAM)
The Trinity groundwater availability model (GAM) is part of the TWDB GAM program. The program has its roots in the many groundwater models developed over the past few decades in Texas for aquifers or portions of aquifers. While the GAMs are developed to better characterize and understand the aquifers of Texas, other models such as water quality or recharge distribution models are key to building balanced groundwater models that reflect and utilize known aquifer characteristics and movement of groundwater so as to accurately simulate the aquifer, past, present, and future.
The models in the TWDB GAM program are used to address current and future estimates of available groundwater. So as to better understand the current discussions of managing the Hill Country portion of the Trinity Aquifer (see “Managing the Trinity”), it is important to understand what information, data, and modeling on which such decisions are based. Therefore, this webpage gives an overview of the TWDB GAM for the Trinity Aquifer in the Hill Country (Mace et al. 2000) and its subsequent updates and model runs.
Groundwater models begin with establishing as much data as possible for the simple reason – it is very difficult to have enough information and data to model, or replicate in data form, hundreds of square miles at the surface and hundreds of feet into the earth’s subsurface, as well as identifying and measuring all the linkages between land and the deeper soil and rock layers. Therefore groundwater modelers look for as much information as possible concerning the area to be modeled.
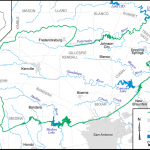
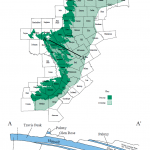
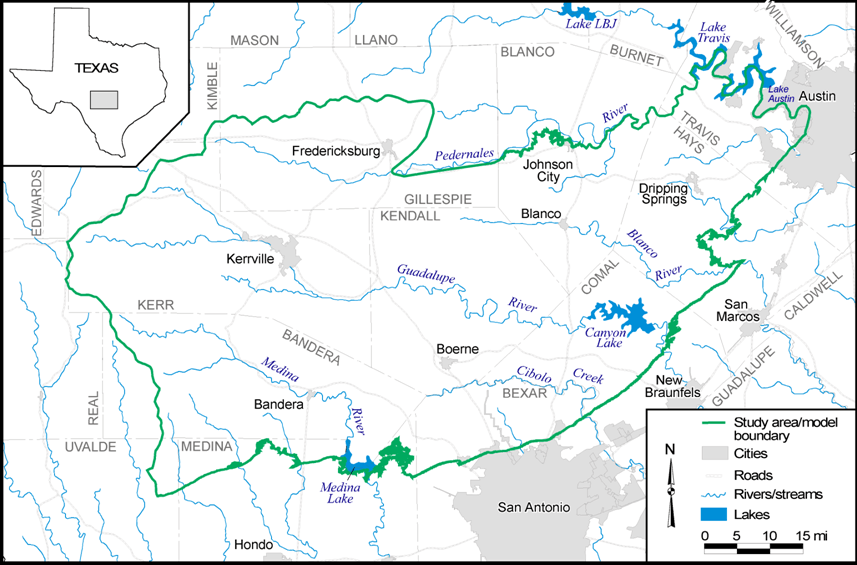
The model boundaries are a subset of the entire Trinity Aquifer shown at right. Thus, these model boundaries are focused on the Hill Country portion of the aquifer.
Another key feature of the map below is the area in dark green where the Trinity rock layers outcrop at the surface – the recharge zone. Rain that falls on this area may replenish the aquifer. In the cross section, the recharage zone is shown where the Antlers and Travis Peak Formations are at the surface in Comanche Country.
Key Features and Model Inputs
- The rock strata are composed of karstic limestone, calcareous sands, and shales. Such rock layers are associated with horizontal and vertical water flow through dissolution features, faults, and fractures.
- Average yields in the Middle Trinity Aquifer are about 250 times less than those of the Edwards Balcones Fault Zone (BFZ) Aquifer.
- The aquifer can fluctuate within a wide range in response to rainfall, drought, and pumping.
Major Model Approach and Inputs:
The numerical model was developed using MODFLOW, a finite difference model coded by US Geological Survey and used in many model areas around the world.
Using 3 layers (the Upper and Middle Trinity Aquifers and the Edwards-Plateau Group), a grid of 1-mile by 1-mile cells was established in the model area for a total of 9,262 active cells plus boundary cells. As far as possible, the model’s numeric and grid structure approximated the rock types, layers, their changes in thickness and depth below ground, and related features.
The model was calibrated to known water levels over time, particularly for 1975 conditions when the data indicated that the aquifer was near steady state, i.e., natural, low pumping conditions on the average. Under these conditions, the calibrated model indicated that ~ 64,000 acre-feet per year flows from the Upper and Middle Trinity zones to the Edwards (BFZ) Aquifer.
Water levels: historic water levels recorded in wells across the model area were input to the model grids. Wells are often installed to different levels in the aquifers.
Hydraulic conductivity: Hydraulic conductivity or (K) is the amount of water that flows through the pore spaces of a cross-sectional area of the aquifer, typically expressed in units of feet or meters per day. Hydraulic conductivity values used for the model relied on previous studies:
- 0.1 – 10 ft/day (Hammond, W. W., 1984, Hydrogeology of the Lower Glen Rose Aquifer, South-Central Texas: Ph.D. dissertation, The University of Texas at Austin. 243 p.)
- 10 ft/day (Barker, R. A., and Ardis, A. F., 1996, Hydrogeologic framework of the Edwards-Trinity aquifer system, west-central Texas: U.S. Geological Survey Professional Paper 1421-B, 61 p. with plates)
- 0.0001 – 0.003 ft/day in the Hammett and Upper Glen Rose (Guyton, W. F. and Associates, 1993, Northern Bexar County water resources study for the Edwards Underground Water District- Volume 1: Ground water: final report to the Edwards Underground Water District, San Antonio, Texas, 66 p., tables and figures)
Due to the range of factors that affect hydraulic conductivities throughout the model area, the K values were input from kriged distributions per water-bearing zone.
Transmissivity: the measure of how much water flows through a horizontal section of the aquifer in squared feet over time (typically per day). The model took into account previous field studies and reported values for transmissivity.
Storativity: this is the volume of water that can be taken from the saturated zone of the aquifer; it is known as specific yield in unconfined aquifers. It’s measured in units of ft/ft or meter/meter and thus is dimensionless. Values considered for the model ranged from 3 x 10⁻⁵ to 10-3. Values input into the model were from test locations.
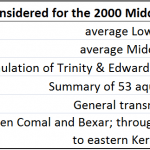
Recharge: estimates of recharge can be difficult, and there are multiple methods for such estimates. For the 2000 Trinity GAM, the following estimates of recharge as a percent of rainfall were considered.
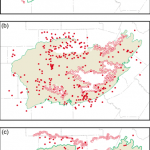
Model control points: As the data points (wells, outcrops, groundwater-surface water interactions in river beds, etc.) are located across the study area, identifying those locations for the baseline model is also important. The following three maps show the bottom elevations for a) the Edwards, b) the Lower Trinity, and c) the Middle Trinity. Along with other structural data and information, these were used to prepare the 2000 GAM model.
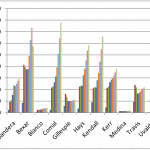
Estimates of groundwater pumping by county in acre-feet per year. Historic values were established for the years 1975-1997; values were projected for subsequent years.
Model Projections and Groundwater Drawdown
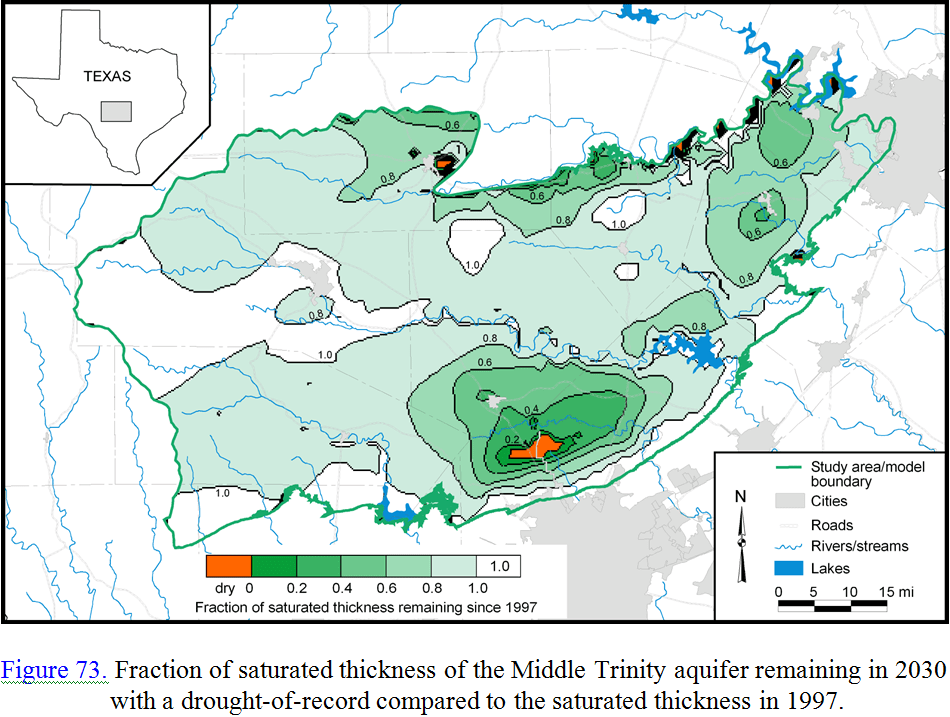
Having been tested for calibration, or “steady state” using historic groundwater pumping and water levels in the aquifer, the GAM was then used to test scenarios of future pumping. As shown in the graph above, future pumping levels from 2010 to 2050 were estimated to increase based on population growth projections and increased groundwater withdrawals from the aquifer. The GAM results indicated that areas of the Hill Country Middle Trinity Aquifer could “go dry” in areas of heaviest pumping under drought-of-record (the 1950’s drought) conditions:
Model scenario based on 1997 aquifer water levels and pumping:
Model scenario based on projected 2030 aquifer water levels and pumping:
Model scenario based on projected 2050 aquifer water levels and pumping:
Model Limits and Assumptions
- The model utilized data from the Upper and Middle Trinity Aquifers and the Edwards Group in the Hill Country Plateau; the Lower Trinity Aquifer were not included in this model. A key assumption used to prepare the model inputs was “no-flow” between the Middle and Lower Trinity aquifers.
- The model grid of 1×1-mile cells supported the overall model, but is not sufficiently detailed to address smaller-scale features and pumping scenarios.
- Data for hydraulic properties such as conductivity, transmissivity, storativity, thickness of hydrostratigraphic layers, etc., were based on available information and in some areas of the model boundaries, limited data.
- Recharge was assumed to be linear with precipitation, however, the model authors recognized that this is not necessarily linear due to local factors such as soil thickness and ground slope.
Summary of the 2000 GAM modeling results:
- In 2010, the aquifer may experience 100-foot declines in water levels.
- Under the 2000 pumping levels, a large part of the aquifer may be depleted by 2030.
- In 2040, 100-foot drawdown of the aquifer may be in the Dripping Springs area.
- by 2100, 50 to 100-foot declines may occur in the Hays, Blanco, southeastern Kerr, and eastern Bandera counties.
- Major rivers in the region may continue to flow seasonally even with increased pumping levels and drought-of-record [1950’s] conditions.
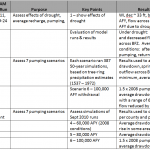
By request of stakeholder and other entities, the TWDB continued to update and refine the Trinity GAM. The following tables provide an overview of that work.
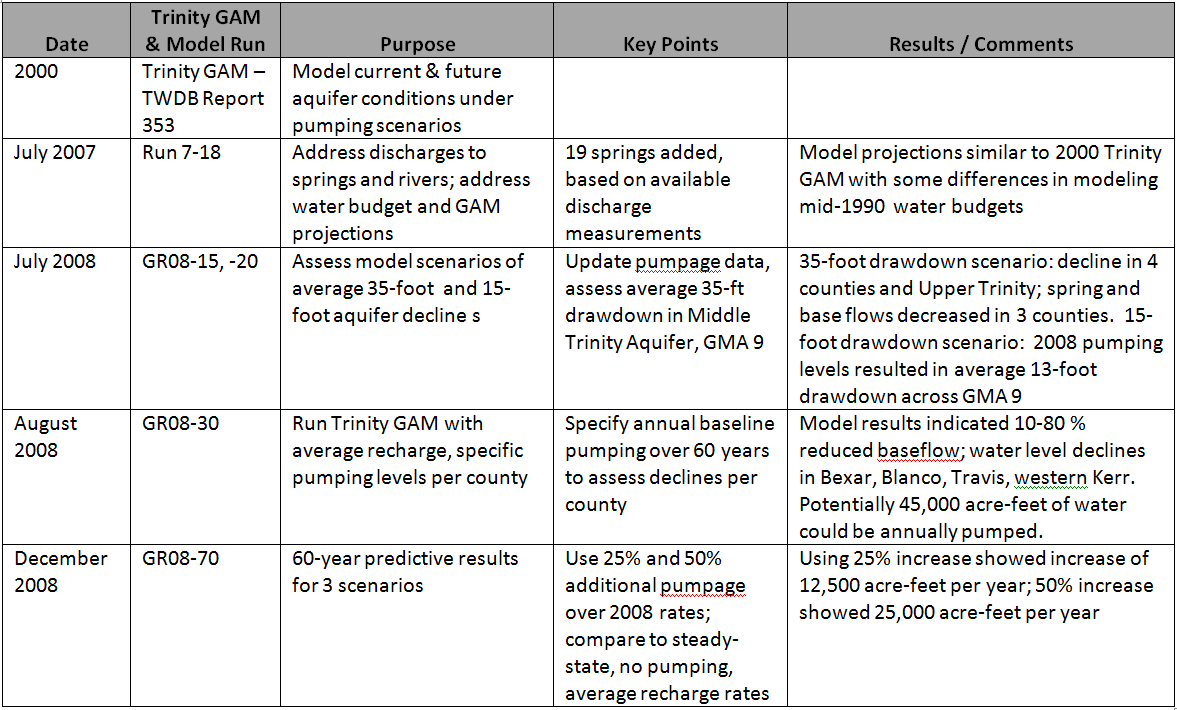
As the above discussions, summaries, and table indicate, groundwater modeling is a needed tool for understanding groundwater over time. Various modeling scenarios help to predict what the impacts of drought and pumping changes may bring to the aquifer. However, models can only provide information for decisions. Managing the aquifer is another story – see the tab, “Managing the Trinity Aquifer.”