EDWARDS (BALCONES FAULT ZONE) AQUIFER – WELLS AND DATA
A great amount of data and information are available for the aquifers of Texas, however it can be difficult and time-consuming to access all such data. This webpage provides information about the Edwards (Balcones Fault Zone, or BFZ) aquifer in graphs, maps and charts to address general questions that pertain to the aquifer and uses of groundwater.
The primary groundwater data source is the Texas Water Development Board’s well records database, available to download or to access through the Water Information Integration & Dissemination (WIID) System. These data records are public and can be downloaded at any time, however the system is updated on a regular basis and therefore discrepancies between different dates of downloads are possible.
Note: As the data sets were not generated by The Meadows Center for Water and the Environment, the data are not under quality assurance/quality control measures in this website.
——————————————————————————————————————–
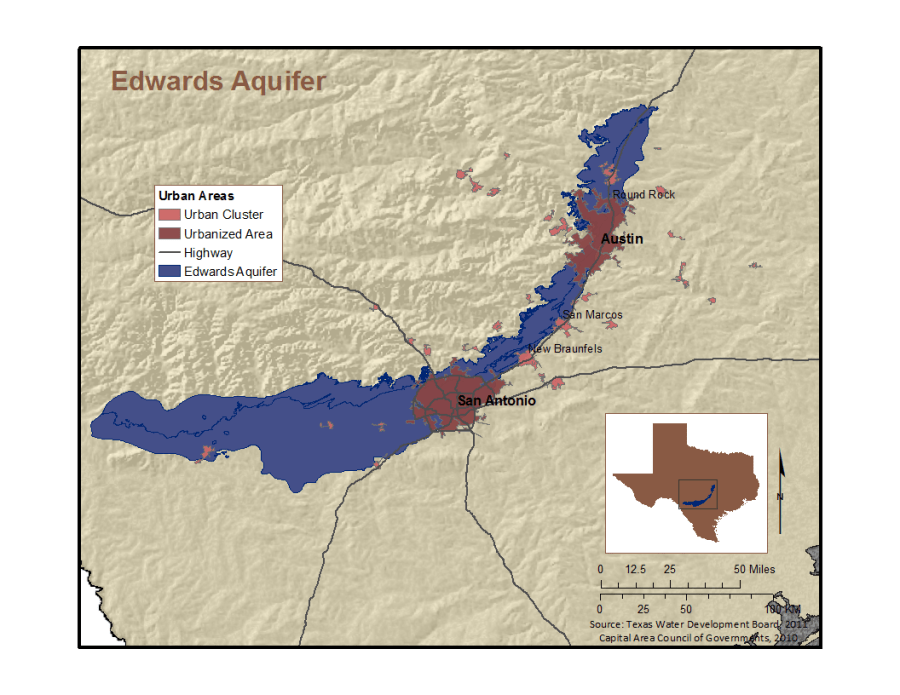
Wells completed in the Edwards Aquifer are found across the region, but particularly along the more productive areas of major fault zones. Over 10,000 wells have been recorded in the Edwards; to date in 201, at least 210 wells have been installed. The following map shows where the majority of wells are installed in the artesian zone, compared to the Edwards Aquifer Authority map of the different zones:
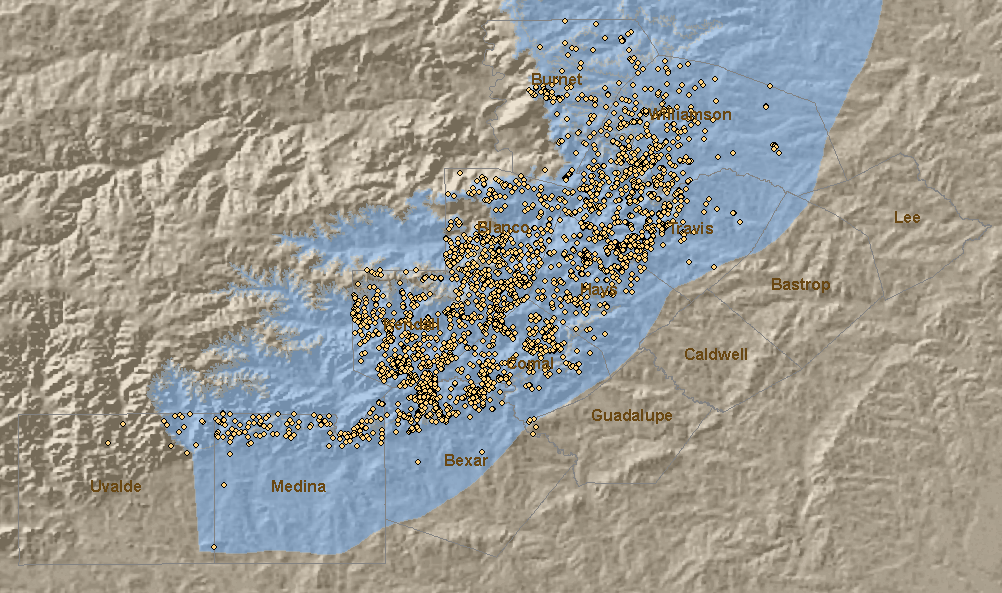 Edwards Wells. Source TWDB. LM Parchman, The Meadows Center Edwards Aquifer System. Source: Edwards Aquifer Authority
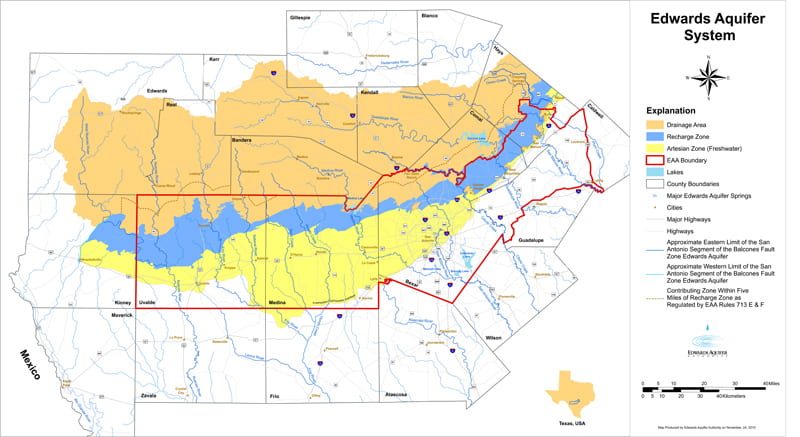
Edwards Aquifer System. Source: Edwards Aquifer Authority
Wells in Texas are identified through the TWDB statewide monitoring program. Each well that is logged and recorded is given a specific number, based on the state well grid.
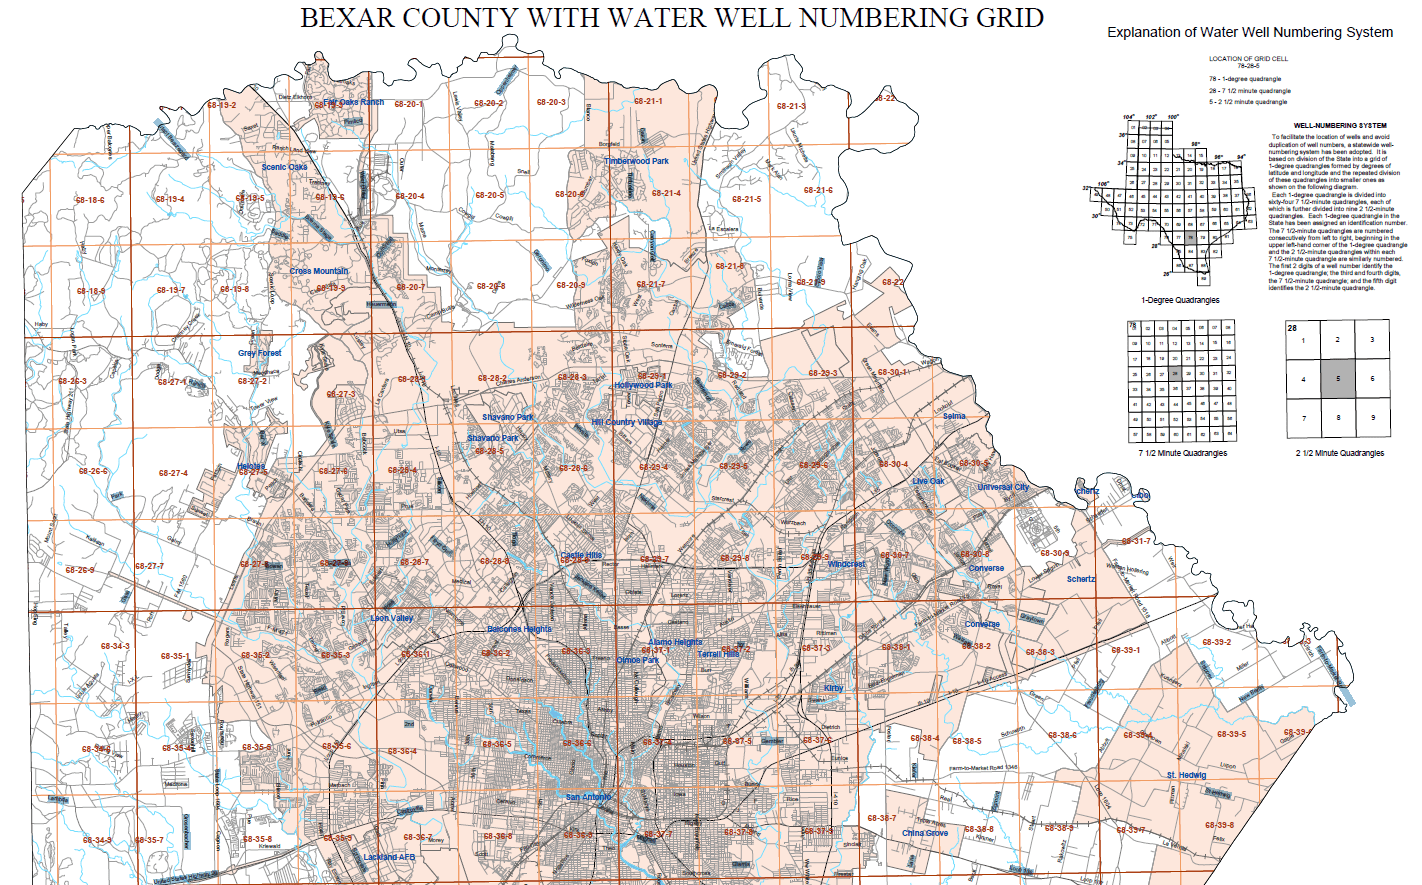 Water Well Grid. Source: TWDB Well Records.
Water levels within the Edwards can vary. A summary table of wells from Edwards and Trinity records highlights the differences in aquifer productivity via number of wells, whereas about one half of the wells have water quality (ion and cation, calcium, bicarbonate, etc.) tests. Water level measurements exist for many of the wells, but depending on well access, are collected through different techniques as noted by the water level code on the right. In searching the TWDB database, one of the factors to note is the number of aquifer codes that are used in the system.
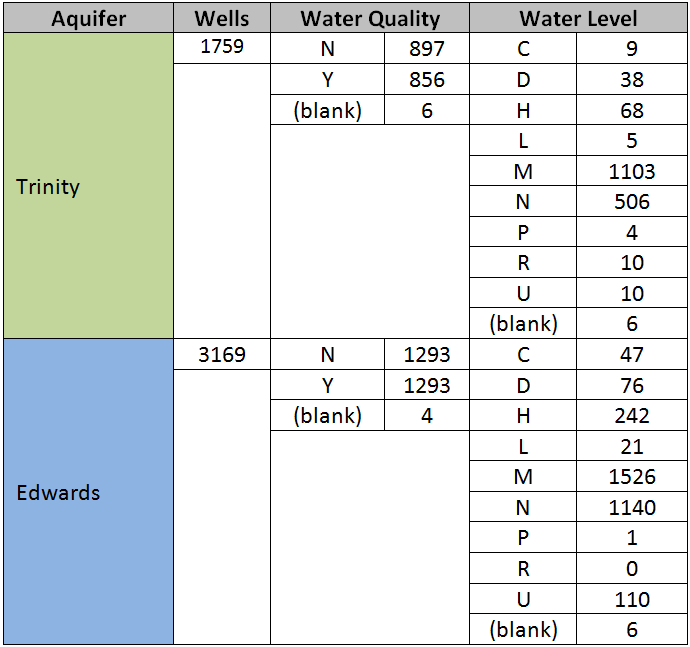 Source: TWDB well records
Additional searching in the TWDB data records indicates:
– Of the more than 3,000 wells installed in the Edwards, 210 were installed in 2011 (to date).
– Well depths in the Edwards range from 23 to 3,086 feet below ground level, whereas water levels range from 6 to 463 meters below the measuring point.
– For the years 2010-2011, the average depth to water was 180.53 feet.
– The water quality parameter Total Dissolved Solids ranges from 234 to 8,512 milligrams per liter (mg/L).
Growth along the I-35 corridor is another way of looking at the excellent water quality available in the Edwards Aquifer:
Edwards Aquifer
Population growth along the corridor is increasing and will continue to have an impact on water resources:
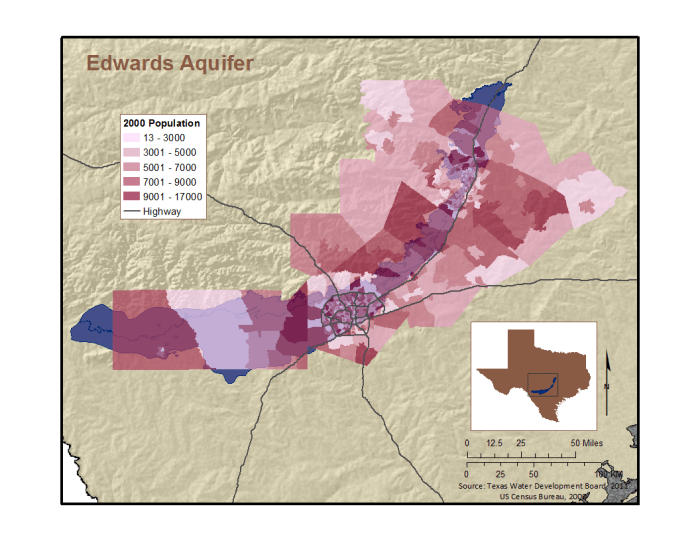
Source: US Census 2000 data. LM Parchman, The Meadows Center
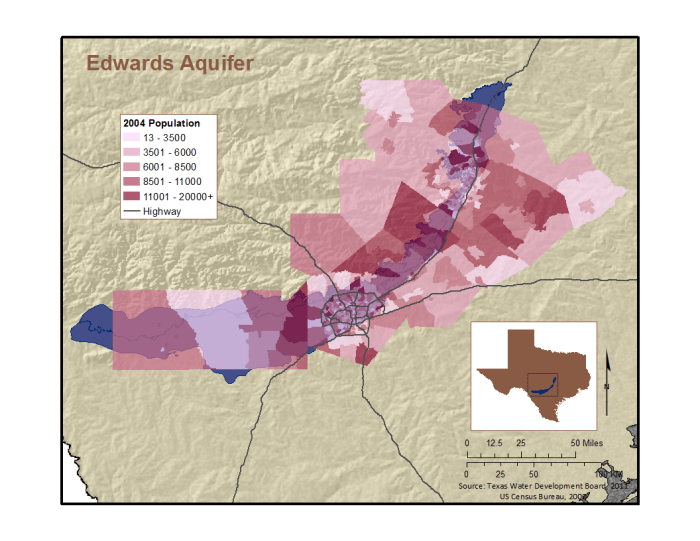
Source: US Census, 2004 data. LM Parchman, The Meadows Center
Well uses in the Edwards also affect where the water is applied:
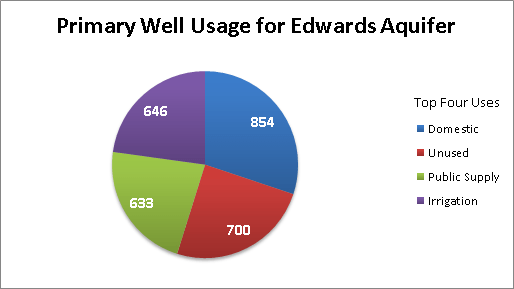 Source: TWDB well records.