
THE TRINITY AQUIFER OF CENTRAL TEXAS
HYDROLOGIC GEOLOGY
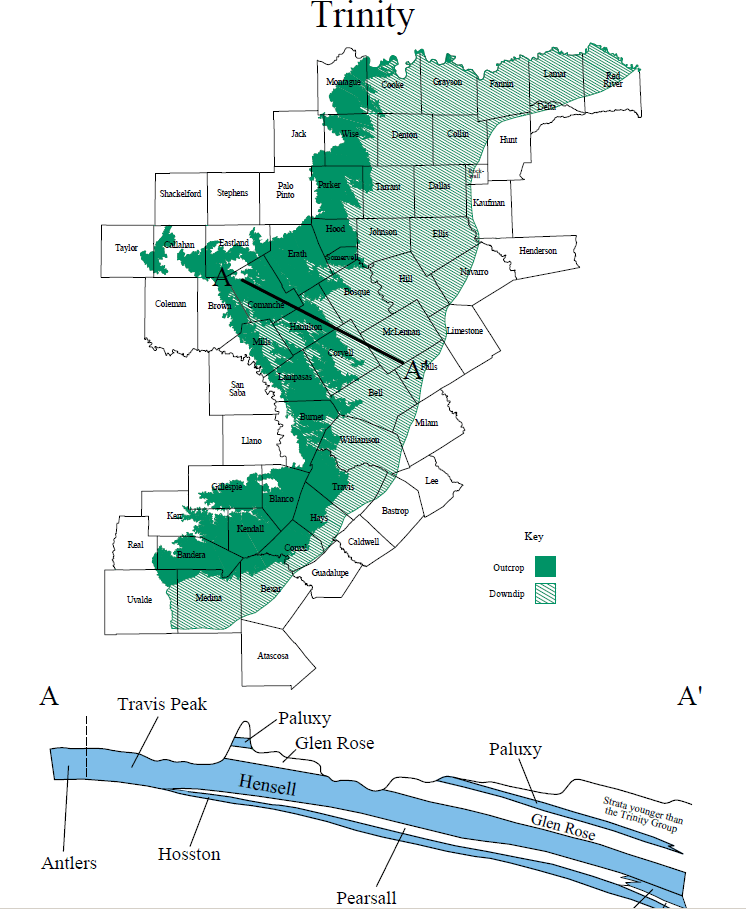
THE TRINITY AQUIFER. SOURCE TWDB
The Trinity aquifer is composed of early Cretaceous-age (145 million years ago) formations of the Trinity Group of rocks. The rock layers are found at the surface or subsurface “through the central part of the state in all or parts of 55 counties, from the Red River in North Texas to the Hill Country of South-Central Texas” (TWDB 2009). Lesser known is that Trinity Group deposits also occur in the Panhandle and Edwards Plateau where they are included as part of the Edwards-Trinity (High Plains and Plateau) aquifers. However, the rock layers are not necessarily connected south of the Colorado River.
In the subsurface, the Trinity consists of layers of limestone, calcareous sands and silts, and conglomerates. These were deposited around 145 million years ago when shallow seas covered much of Texas and parts of the southwestern US. The Llano uplift was higher in elevation and provided much of the land-based sands, silts, and conglomerates found in the Trinity rock layers (Barker et al. 1994).
To better understand the aquifer, hydrogeologists typically begin with the rock layers. Many geologic and groundwater studies have taken place over the years, including field descriptions and rock cores to help match rock layers across more than 50 counties. The diagram below, from TWDB (2009), shows how the rock layers are related.
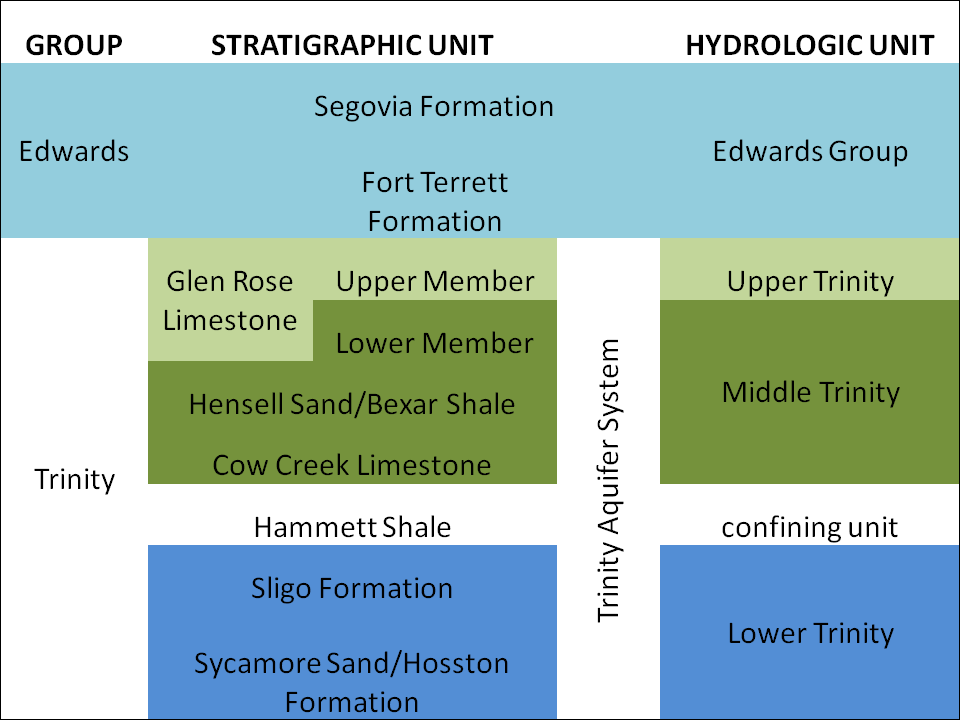
Source TWDB 2009, “Groundwater Availability Model for the Hill Country Portion of the Trinity Aquifer System
This stratigraphic column shows general relationships. However it should be kept in mind that almost all rock strata vary in how deep they below the ground surface and how thick they are at any given location. According to a detailed study of the aquifer (Barker et al. 1994), the Hosston Formation at the base of the Trinity Group is up to 900 feet thick, while the Sligo is around 250 feet thick. The Hammett Shale, a rock unit that is known as a “confining” unit through which little groundwater moves, is about 130 feet. The overlying Glen Rose formation has been shown to be up to 1,500 feet thick.
Cross sections are a great way to demonstrate these layers below the surface of the earth. The following two cross sections are in the TWDB 2009 report on groundwater availability modeling and are based on previous studies (Ashworth 1983: Mace et al. 2000). The sections are drawn from north (or A on the left side of the top column) to south (A’ at the right side of the bottom column) across the Hill Country, and the vertical scale on the left shows the elevation of the rock strata in feet above sea level. The horizontal scale of one inch = 6 miles, while exaggerated in comparison to the vertical scale, allows visualization of the layers at depth. A map insert into the top section shows the general location of the cross section, and the legend noting the names of the rock formations per color band.
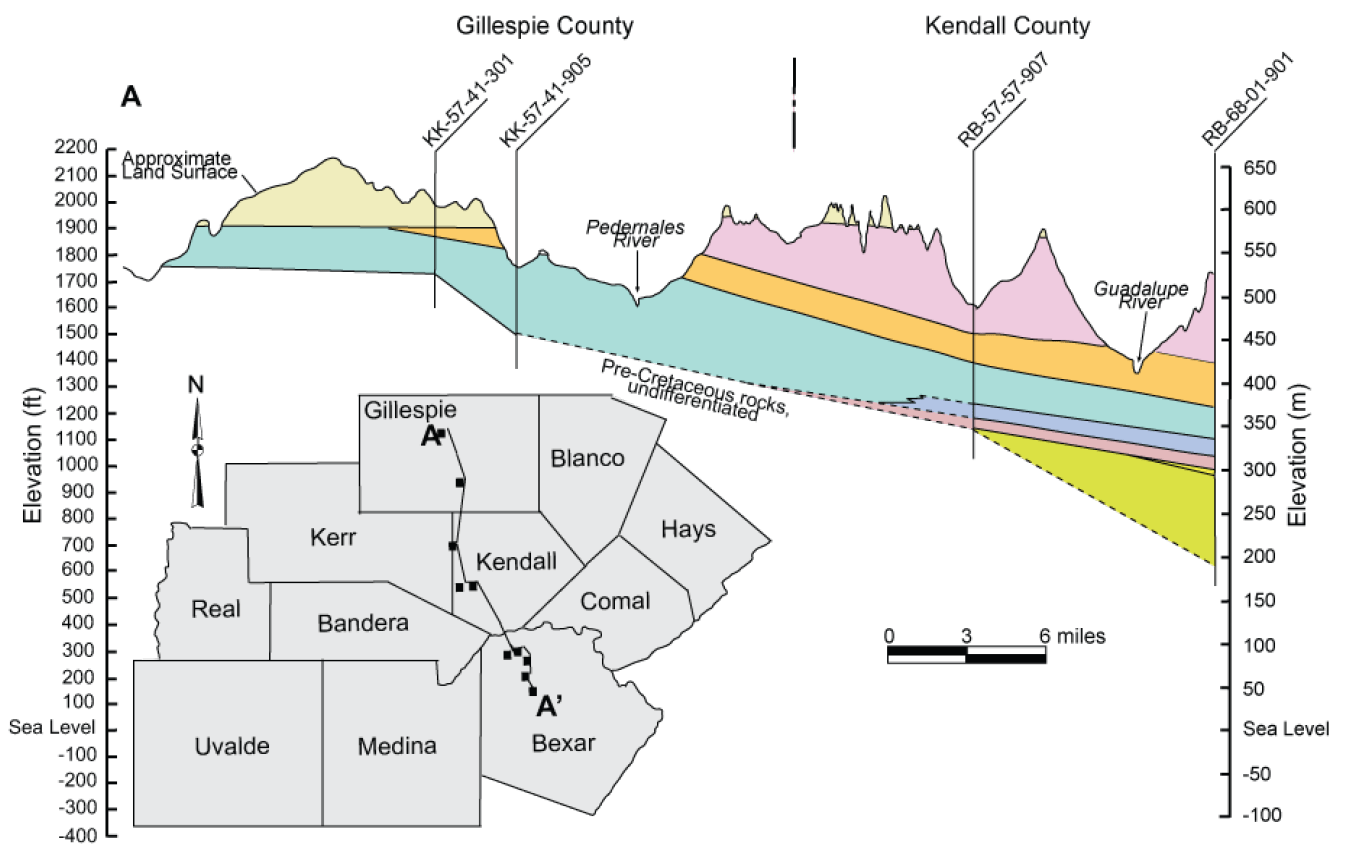
Source TWDB 2009, “Groundwater Availability Model for the Hill Country Portion of the Trinity Aquifer System”
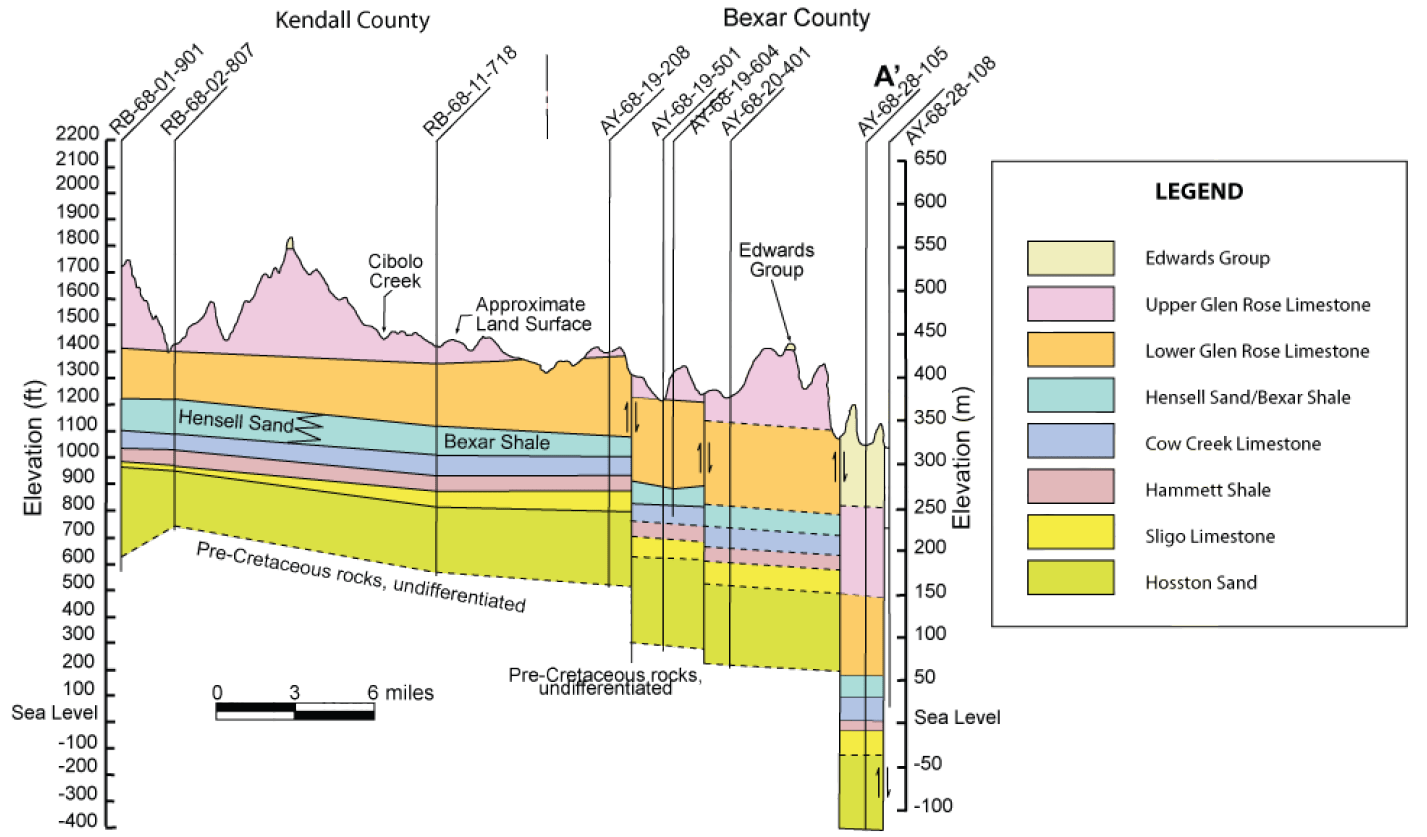
Source TWDB 2009, “Groundwater Availability Model for the Hill Country Portion of the Trinity Aquifer System”
In the cross sections above, well cores are noted by vertical lines with a TWDB classification number at the top. The rock cores help to match field study data with subsurface data and geophysical surveys. However, the well cores are different than the vertical lines with small up/down arrows to either side. These lines indicate the general locations of major faults in the subsurface.
How groundwater flows through this system of layered rocks with different matrices (chalky sands as opposed to limestones), different depths below the ground, and a major fault system is of great interest. Geologists and hydrogeologists with years of experience in the Hill Country aquifers addressed this question through a recent compilation of data, studies, and interpretations. The following cross section, developed from several research studies an published in the Hays-Trinity Atlas, is similar to the above cross sections, but includes generalized groundwater flow through the layers (arrows in blue).
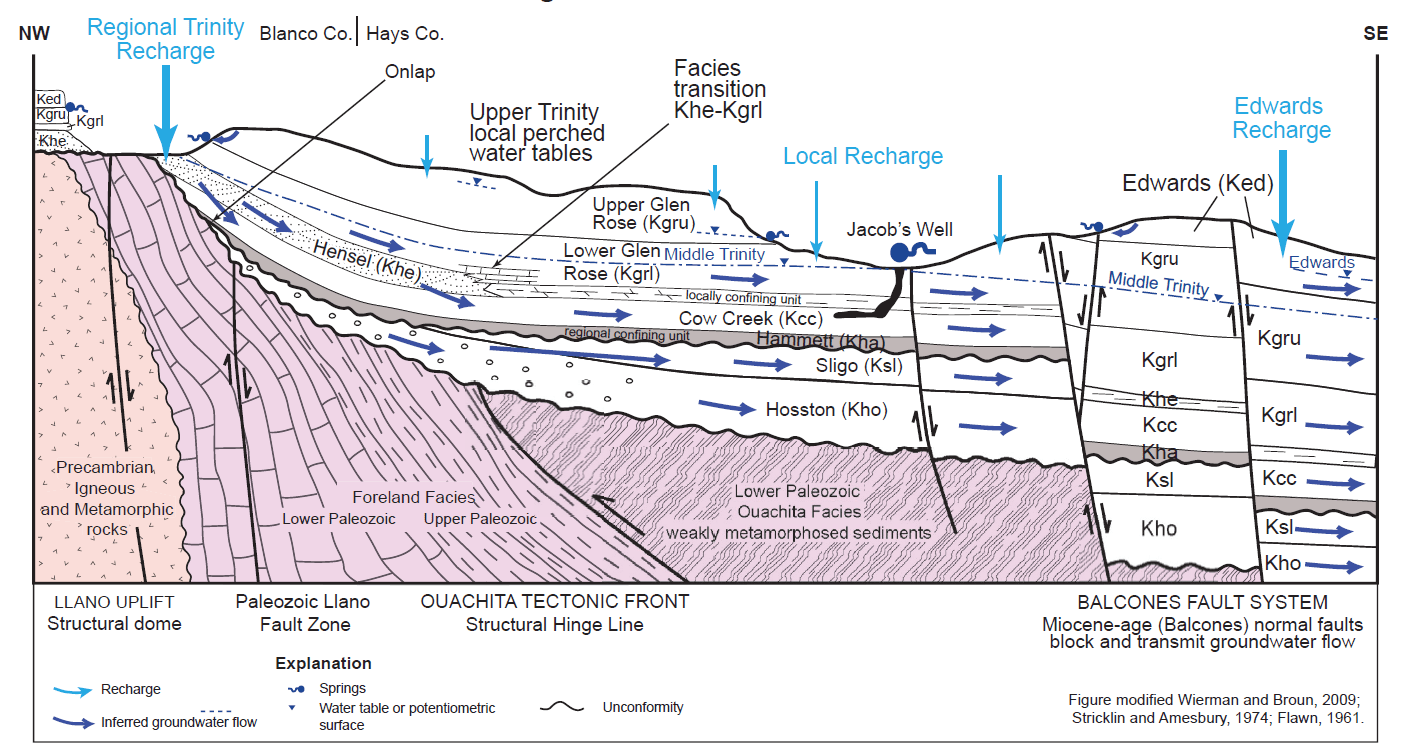
Source Hydrogeologic Atlas of the Hill Country Aquifer, 2010
Beginning from the left of the diagram, a major portion of Trinity groundwater recharge begins via rainfall on exposed rocks of the Hensell and lower Glen Rose. This water percolates into the subsurface layers. Towards the middle of the diagram, light blue arrows at the surface indicate that rainfall can infiltrate into the shallow rock layers but tends to do so in a localized manner. Major springs such as Jacob’s Well receive artesian flows from deep aquifer levels.
WHAT DOES ALL THIS MEAN FOR THE TRINITY AQUIFER?
- Rainfall and runoff carrying various chemicals can easily enter different water-bearing layers of the Trinity aquifer system.
- The localized nature of the recharge zones means that when there is no rainfall, little water enters the Trinity system. The longer between rainfall events as is occurring during the 2011 drought, the lower the aquifer levels are.
- When the aquifer levels decrease below the zones that provide water to creeks and springs, those natural features will dry up, affecting water supplies to humans and the environment.
- Well pumping in the Trinity also affects water levels. From the TWDB report overview of the Trinity:
- Water levels in the Trinity around the Fort Worth-Dallas region have previously dropped as much as 550 feet.
- Water levels in the Hensell and Hosston formations around Waco have declined up to 400 feet.
ADDITIONAL RESOURCES
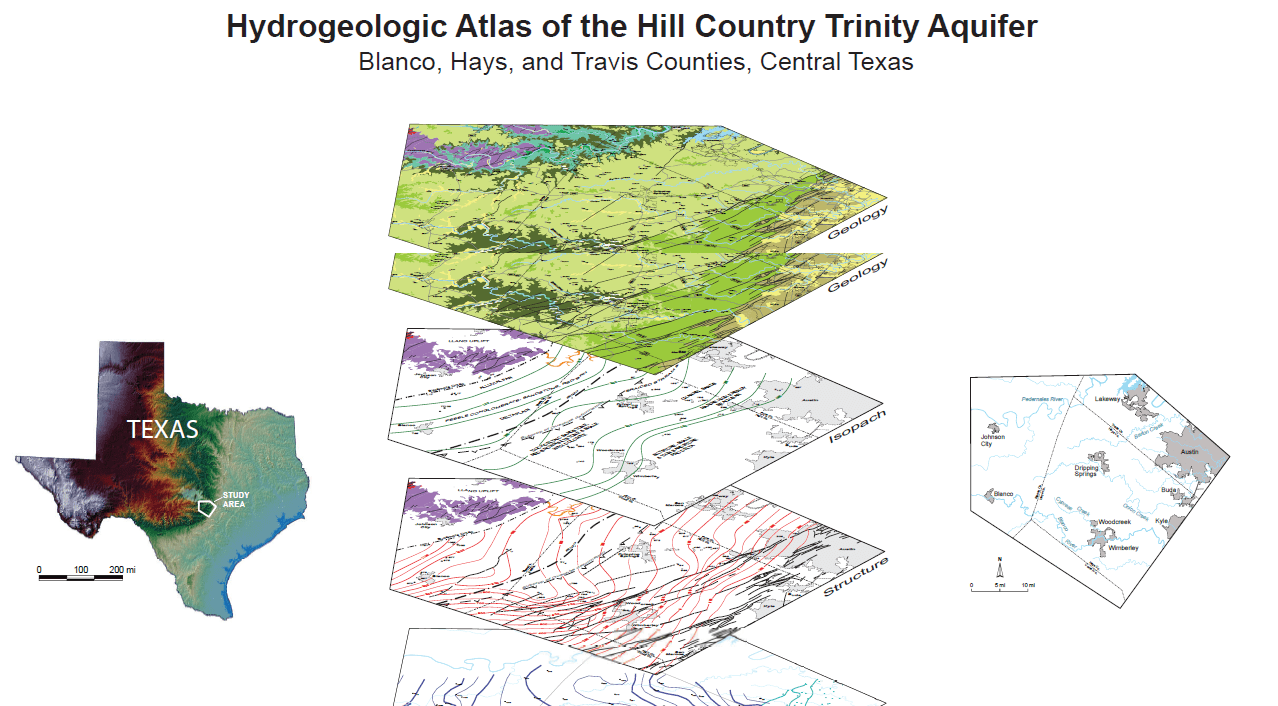
Atlas Cover
- For an excellent, in-depth review and analysis of the Trinity Aquifer as well as detailed, up to date information about the Trinity Aquifer in the Hill Country, please check out the “Hydrogeologic Folio Atlas of the Hill Country Aquifer, Blanco, Hays, and Travis Counties, central Texas.”
- The Hays-Trinity Groundwater Conservation District has excellent sources of information about aquifers, water resources, and relevant reports from federal, state and local agencies. http://haysgroundwater.com/research/aquifer-science